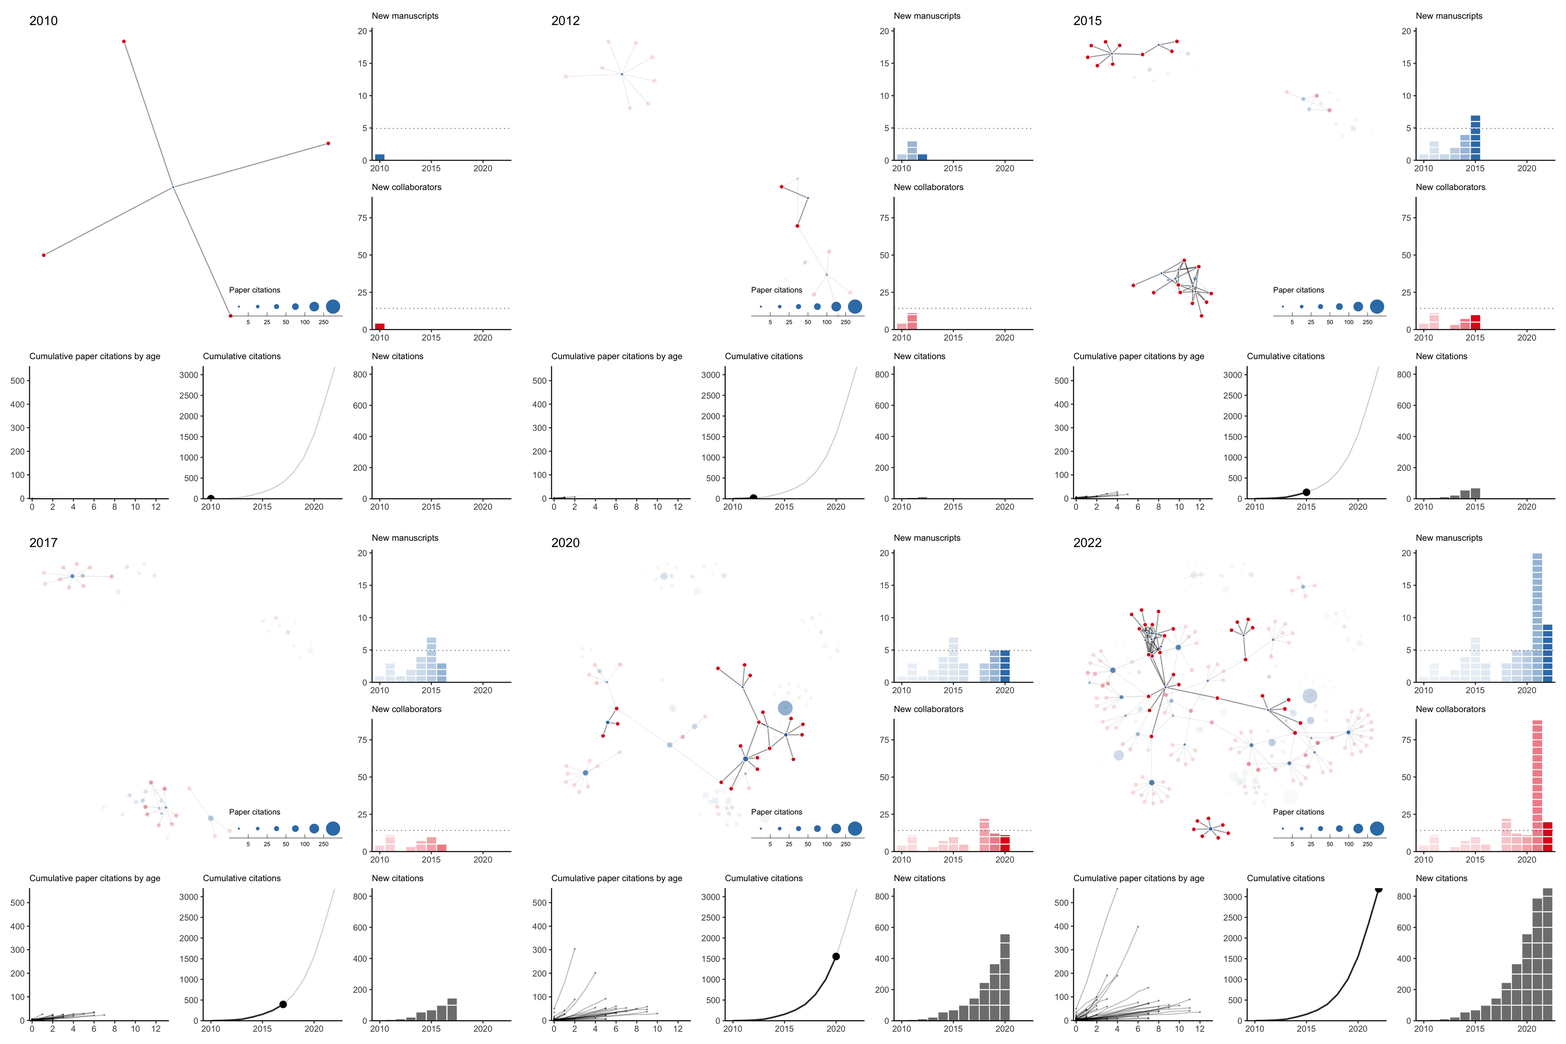
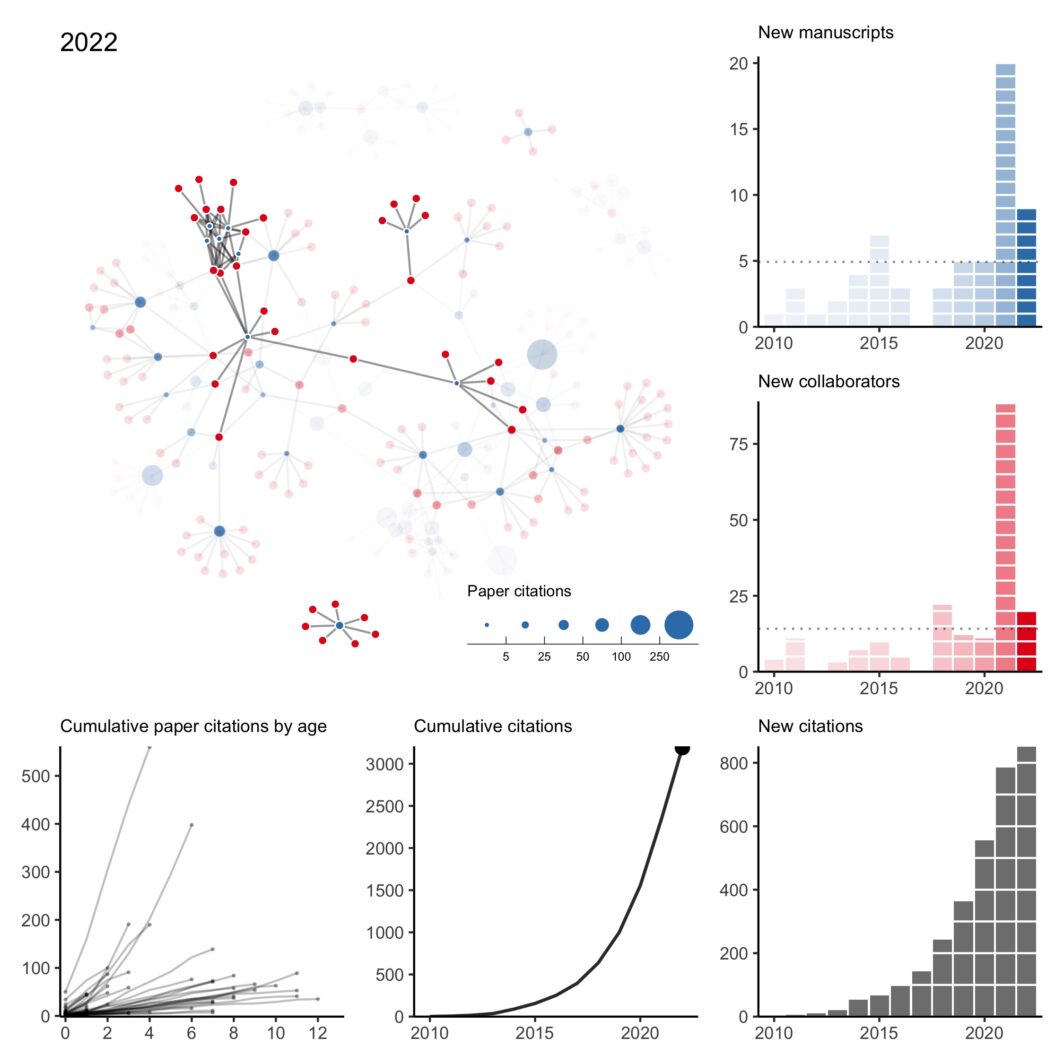
As is always the case when I do this exercise, I can’t help but reflect back on 2022 (and 2021) with gratitude and appreciation for my amazing collaborators. It was my first year on the tenure-track and hours that normally would have been spent pushing research forward were instead spent getting my feet under me, taking on new students, hiring new postdocs, building up some community partnerships, shuffling through administrative tasks, etc. There’s a lot of things I enjoy about the job but by far the most enjoyable thing is working on things I think are interesting and important with people I like.

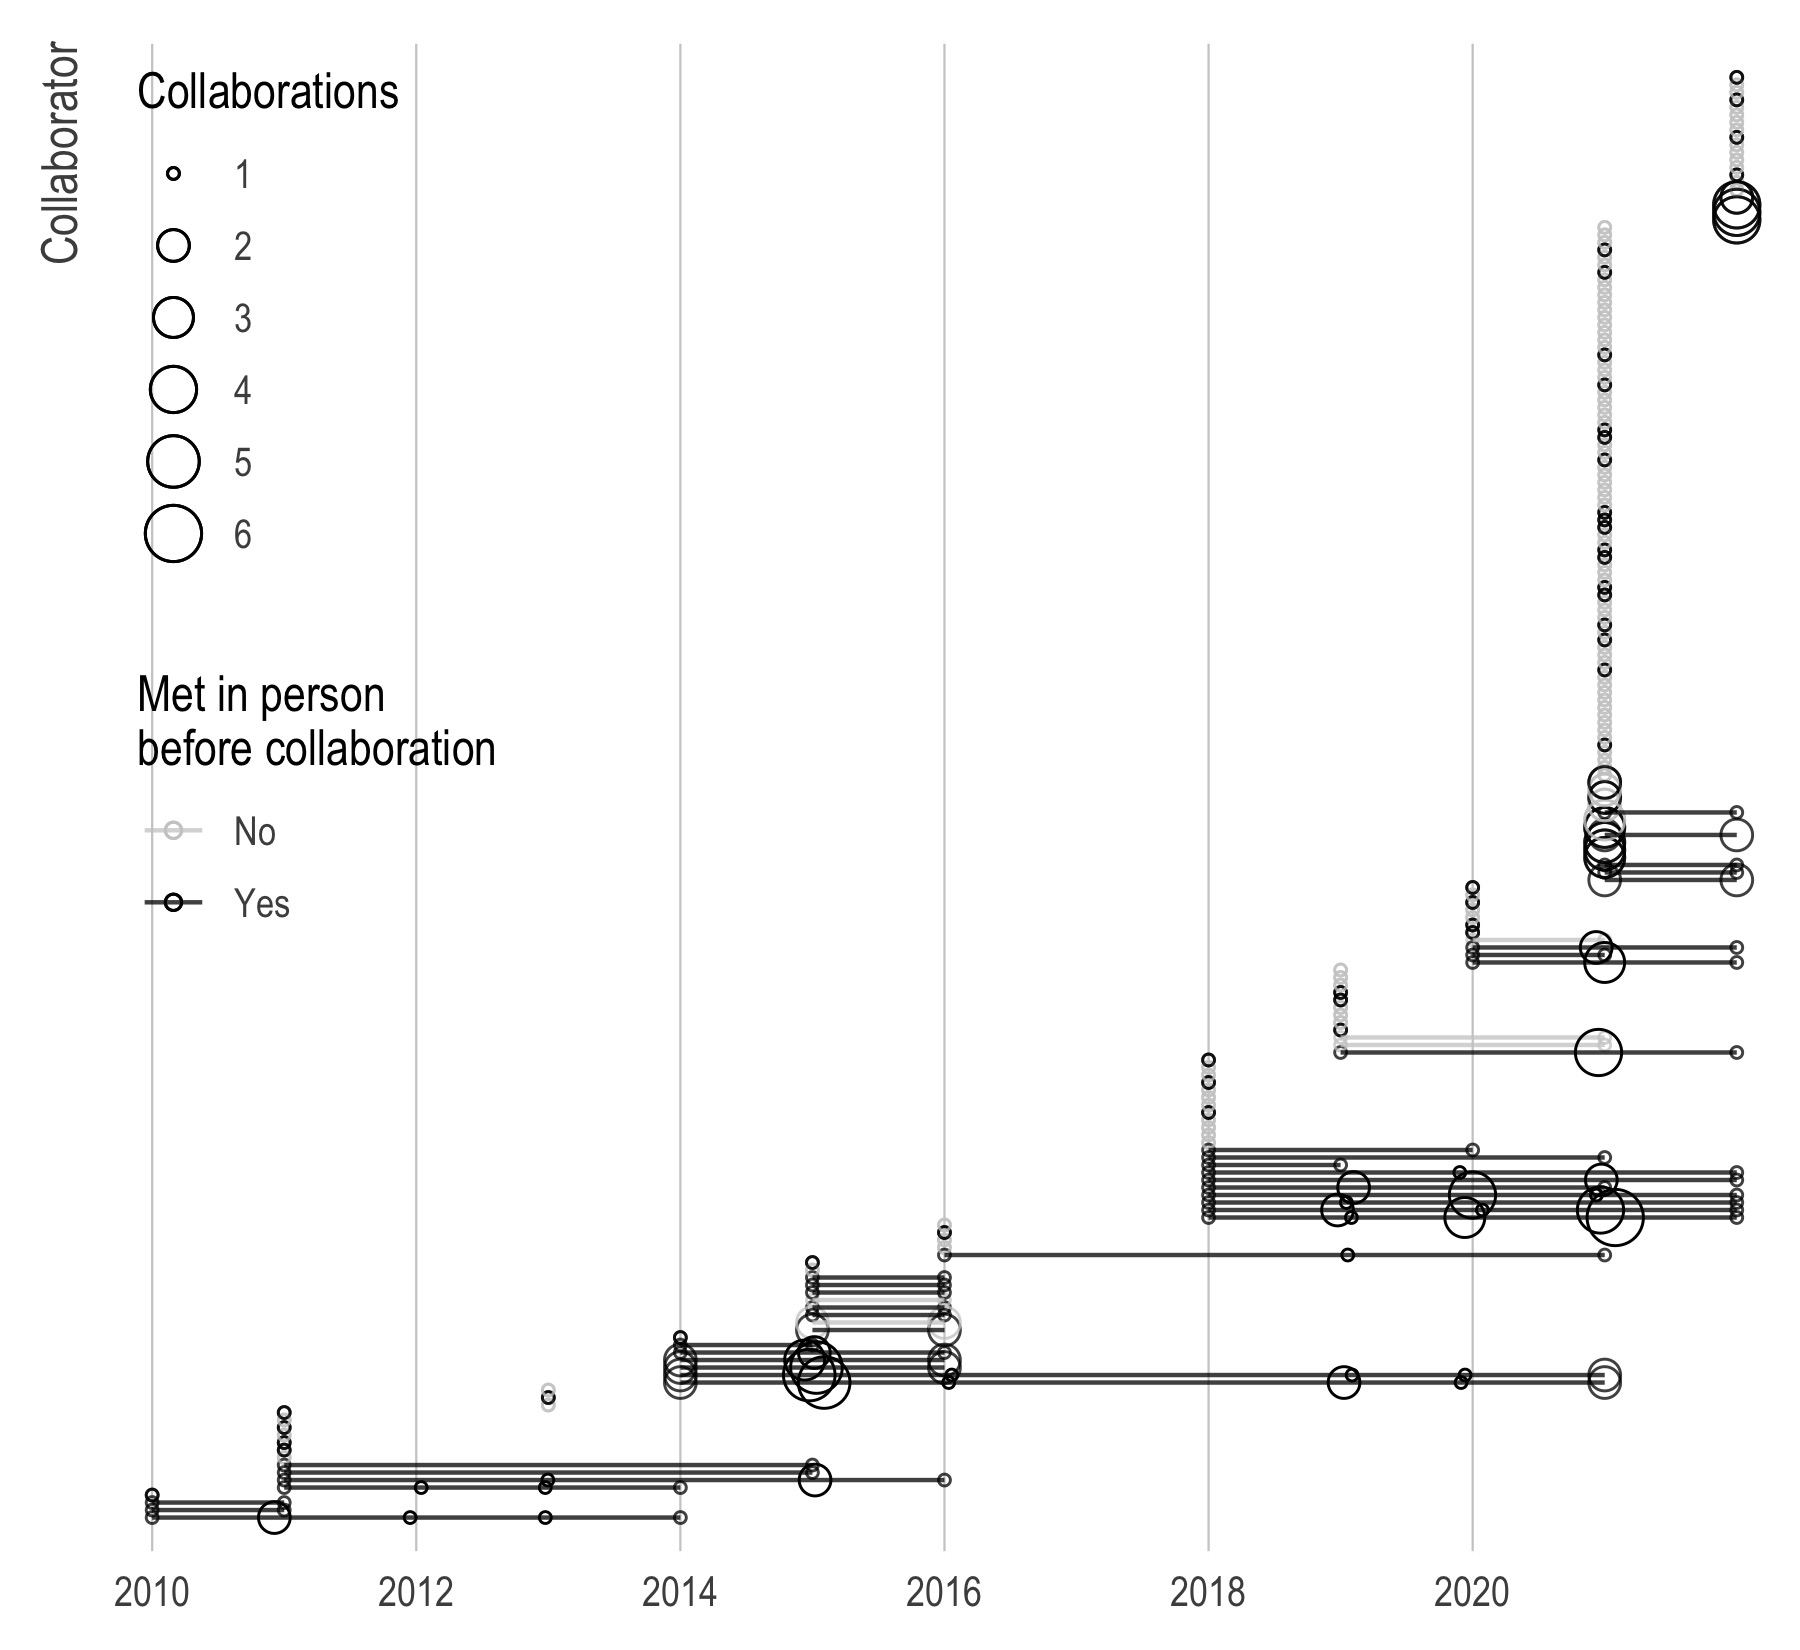
Below is a plot of collaborations (circles) over time (x-axis) by collaborator (y-axis). The grey ones are collaborators I’ve never actually met in person while the black ones are collaborators I’ve met in person. I had assumed COVID would have impacted collaborations such that there would be many more collaborators I’ve never met in person but that doesn’t seem to be the case.

Here is a set plot of my top ten collaborators (in terms of numbers of collaborations) and their different sets. Surprisingly, this list has changed pretty substantially since 2020 with a core group of UCSF researchers (Kirsten, Maria, and Yea-Hung) shooting up the list. 
Conditional on having more than one collaboration, who are my “most efficient” collaborators in terms of average number of citations per project?

And lastly, do COVID-19-related papers get more citations than non-COVID papers? Below I plot all papers published since 2020 along with their annual citations. The ribbons and bold lines represent the linear fit. As you can see, COVID papers have both a higher intercept (they get more immediate citations) and a slightly higher slope (they are cited more over time) that is probably not statistically significant. 
