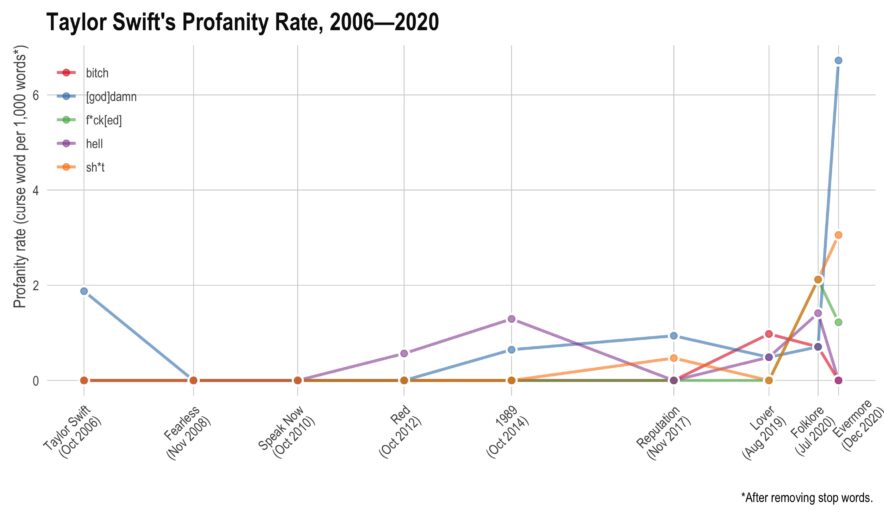
aylor Swift has recorded 9 albums, each of them (except the most recent) has gone multi-platinum. In total, she has sold over 200 million records, won 10 Grammy’s, an Emmy, 32 AMA’s, and 23 Billboard Music Awards. Not bad for somebody who just turned 31. This year, she’s managed to release two albums — they’re both very good. However, I noticed there seemed to be more profanity than I had remembered on her older albums. Here, I’ll use tidytext to see if she has actually increased her rate of profanity or if I’m simply misremembering things.
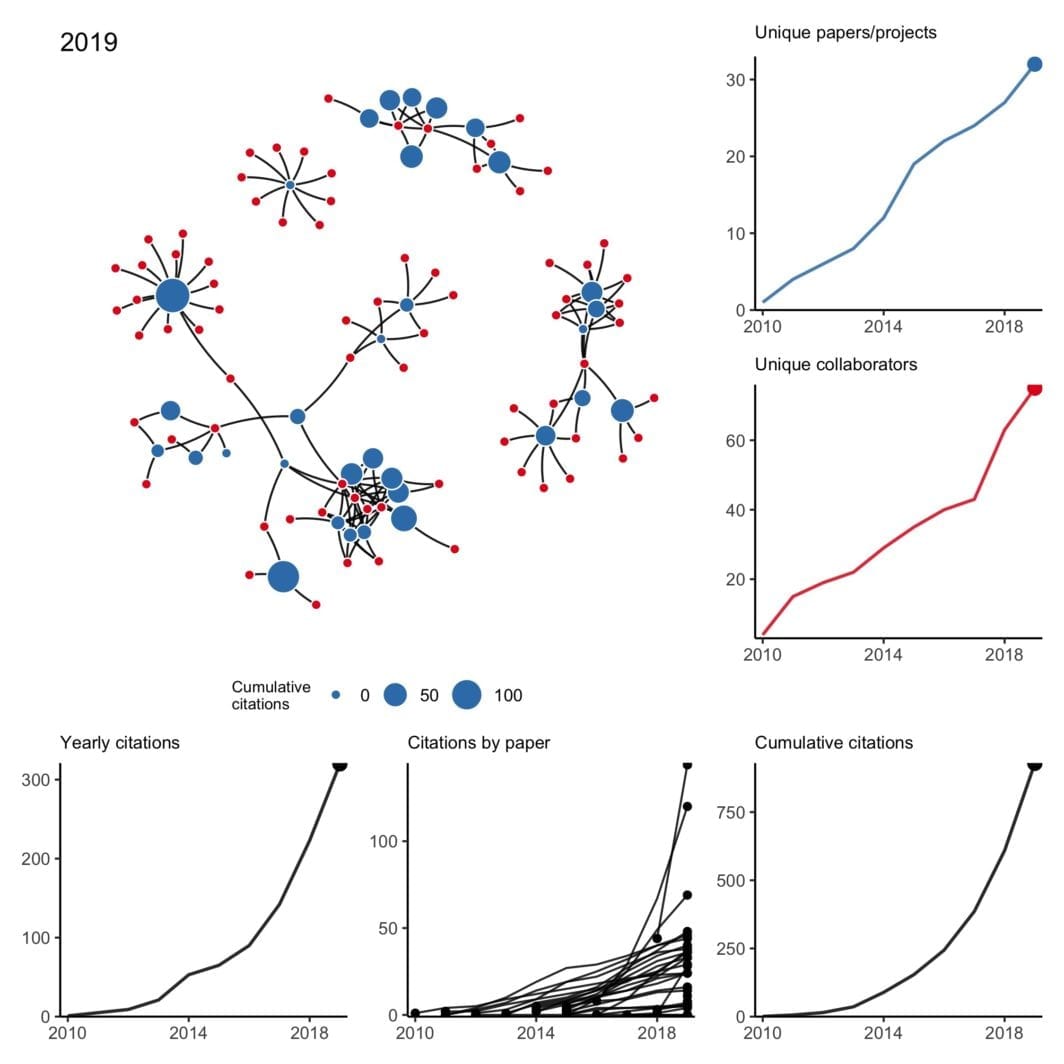
My collaboration network for 2010 to 2020 (+ other plots)
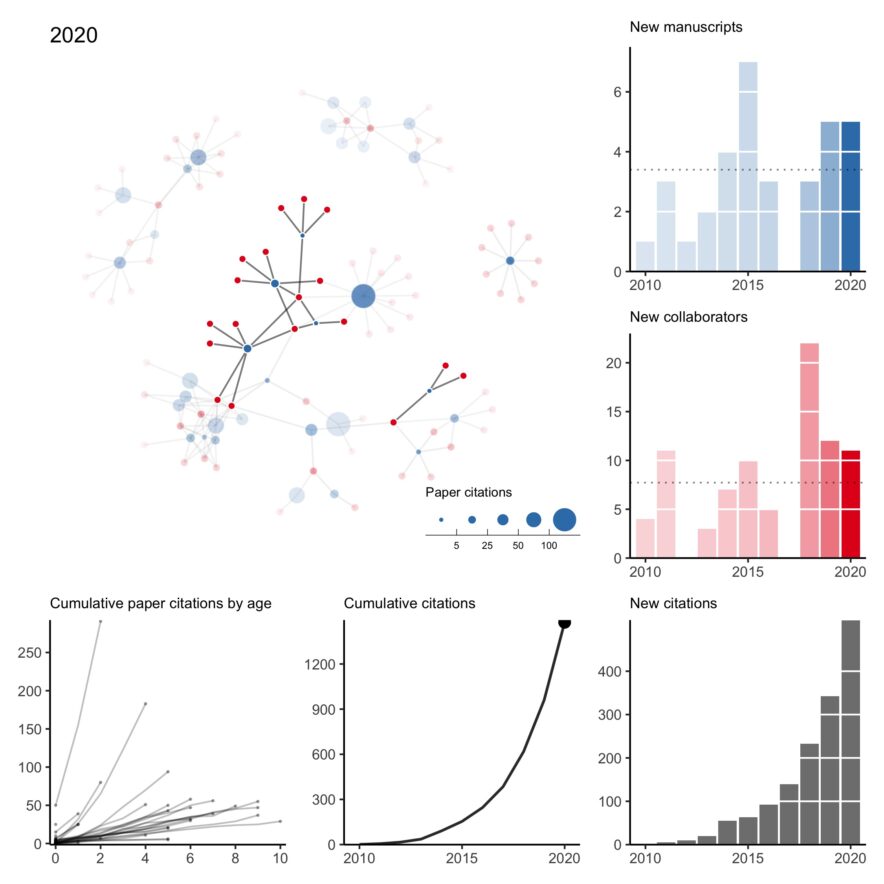
n what has become a bit of an annual tradition, here is my collaboration network for 2010 to 2020. This year was rough. Of the two first-author papers published this year, one was pre-pandemic. I think it’s fair to say this wasn’t the level of productivity I was expecting of myself. Hopefully, a few projects still in the pipeline will come out early next year. All that said, I’m thankful for a strong network of kind collaborators who picked up my slack when necessary, checked in on me even when we didn’t have an active project, and understood when childcare …
Comparing daily (direct) COVID-19 deaths to other causes of death
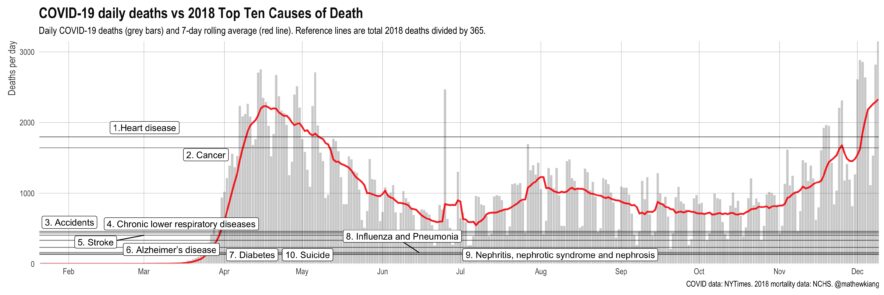
t’s easy to get numb at this stage of the pandemic, but a friendly reminder that daily COVID-19 (direct) deaths have been consistently higher than 8 of the top 10 causes of death (in 2018) since April. We’re on track for over 3,000 deaths per day by Christmas (!!) — things are not good.
Applying an intro-level networks concept to deleting tweets
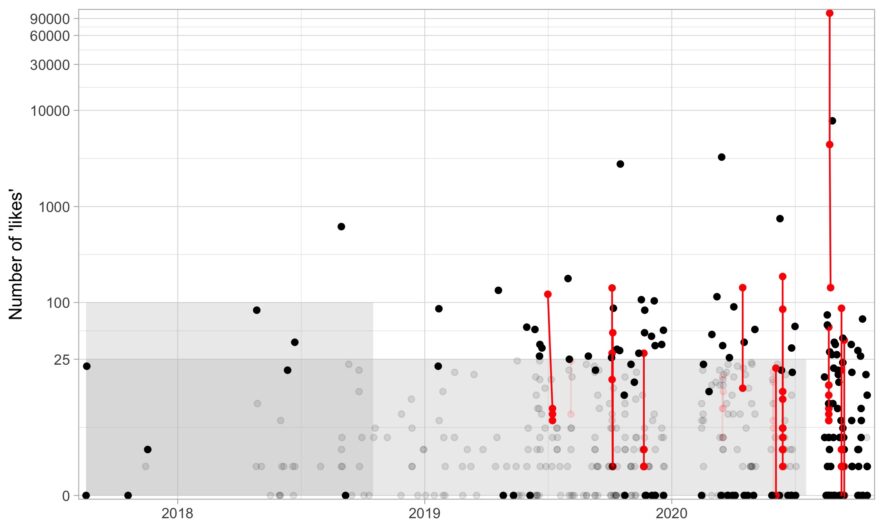
here are a few services out there that will delete your old tweets for you, but I wanted to delete tweets with a bit more control. For example, there are some tweets I need to keep up for whatever reason (e.g., I need it for verification) or a few jokes I’m proud of and don’t want to delete. If you just want the R code to delete some tweets based on age and likes, here it is (noting that it is based on Chris Albon’s Python script). In this post, I go over a bit of code about what I …
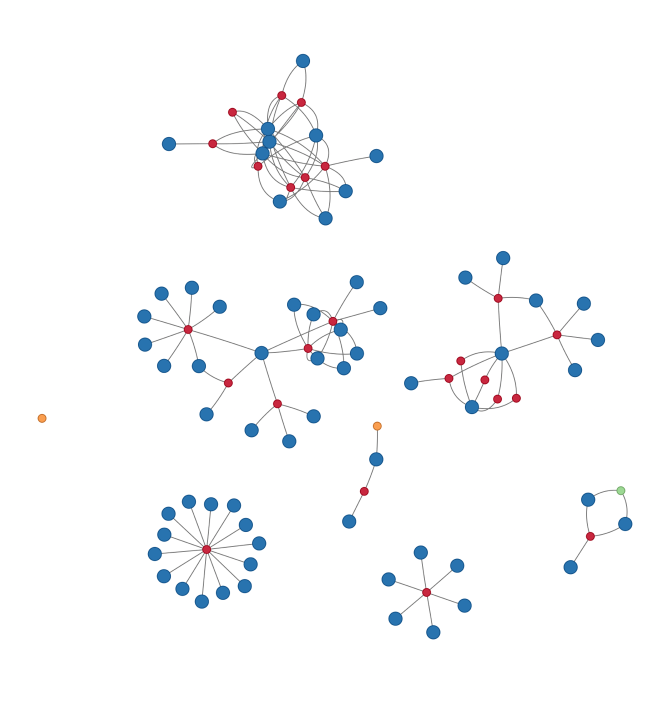
Collaboration network from 2010 to 2019
have been trying to wrap my head around working with temporal networks — not just simple edge activation that changes over time but also evolving node attributes and nodes that may appear and disappear at random. What better way than to work with a small concrete example I’m already very familiar with?
Quick look at NIH K-award funding
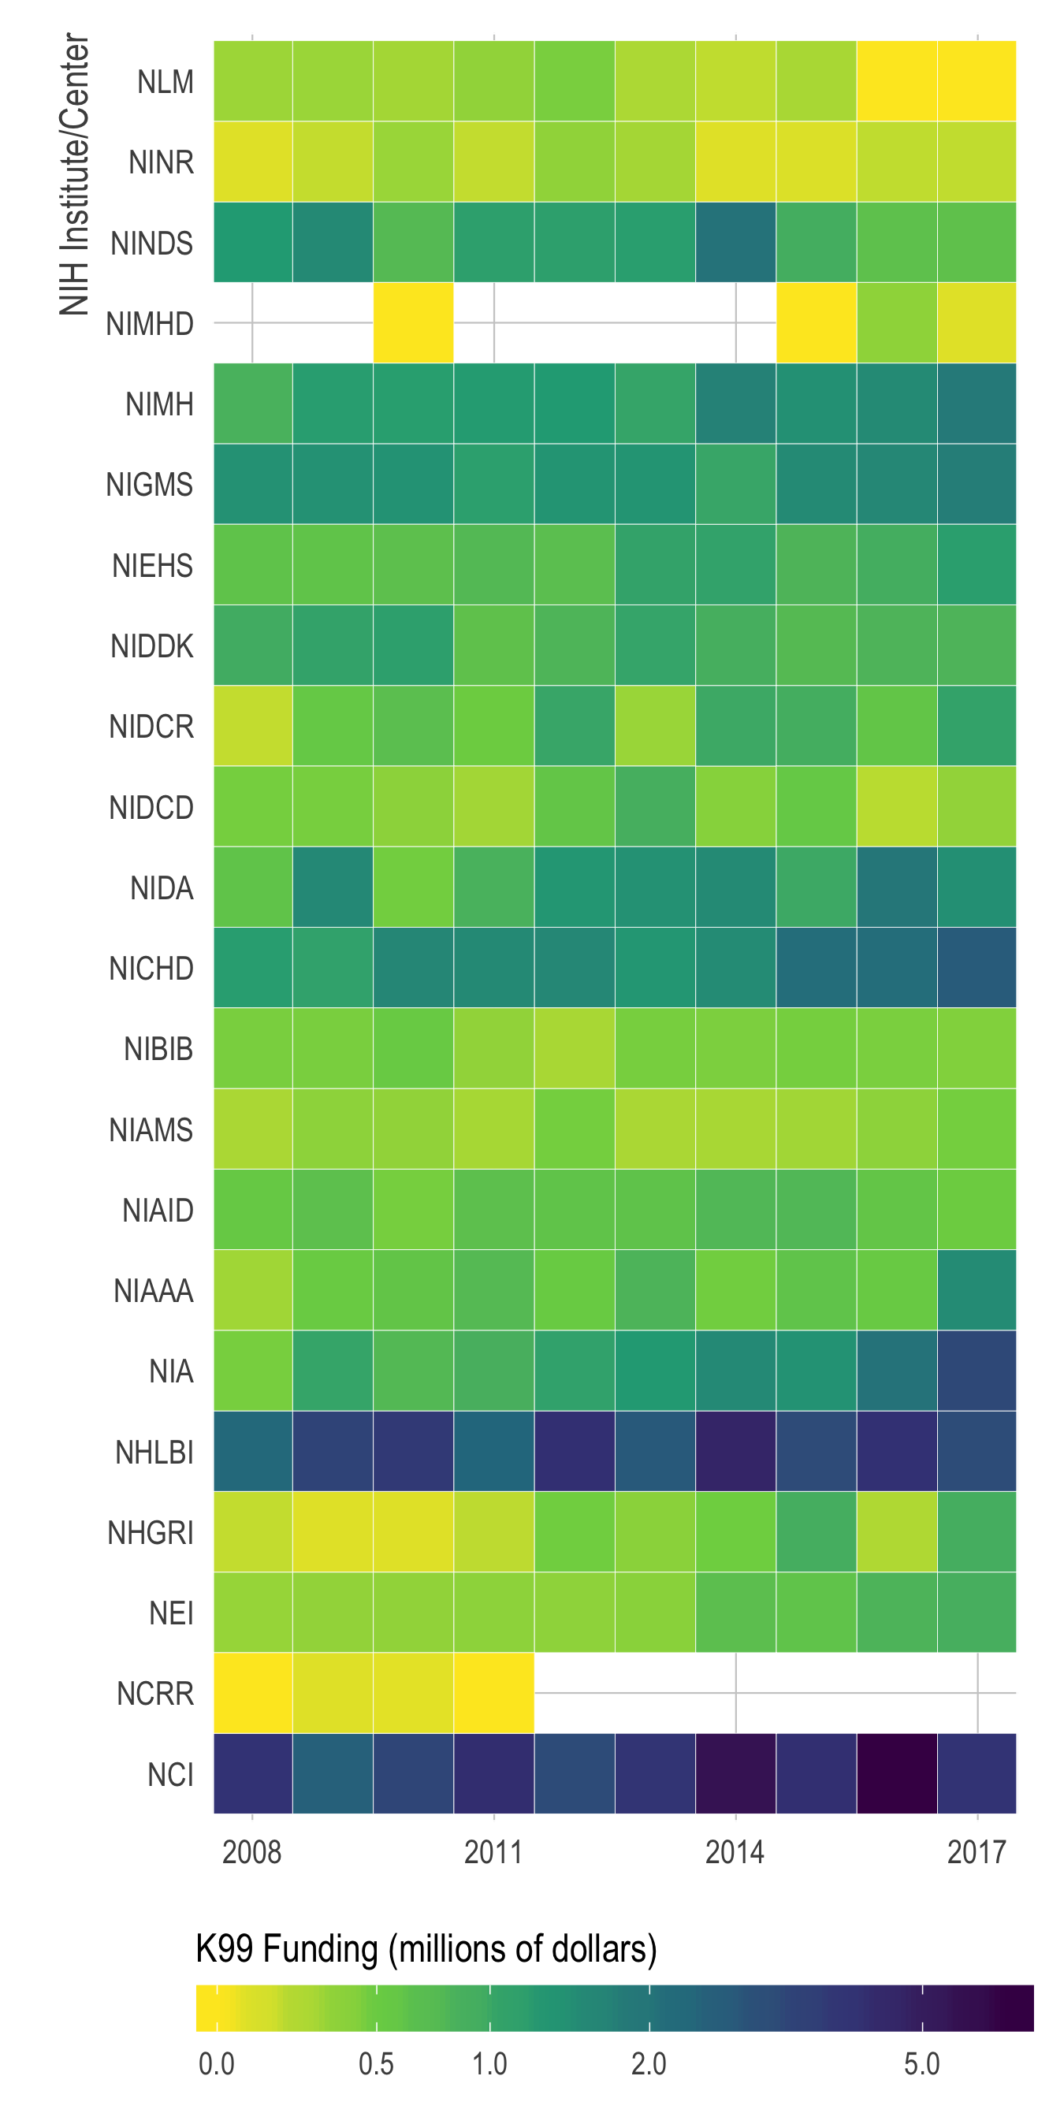
otivated by a chat with Maria Glymour, I took a quick look at NIH K-award funding rates. It’s a very exploratory/descriptive look, but all the code is up on my GitHub. I’m hoping to find time to dive into the data more at some point. Just putting it here, with no commentary, in case others who are applying for K’s might find it useful.
My Collaboration Network
y Twitter timeline is blowing up with #NetSci2018 tweets and awesome visualizations this week, so I was inspired to see if I can quickly make my own “gratuitous collaboration graph” (as Dan would say). Hover over each node to see the name of the paper (red), co-author (blue), or other project (green for data and orange for software).
Using a histogram as a legend in choropleths
espite well known drawbacks,1 plotting parameters onto maps provides a convenient way of seeing context, patterns, and outliers. However, one of the many problems with choropleths is that the area of the regions tend to distort our perception of the value of the region. For example, in the United States, huge (in terms of land mass) counties will tend to have a greater visual impact than small counties (despite often having similar or even smaller population sizes). One way to address this is to use a histogram as a legend on your map. The histogram then provides you with a way …
Use bash to concatenate files in R
ften, I find I need to loop through directories full of csv files, sometimes tens of thousands of them, in order to combine them into a single analytical dataset I can use. When it’s only a few dozen, using fread(), read_csv, or the like can be fine, but nothing is quite as fast as using awk or cat. Here’s a snippet of code that allows one to use bash in R to concatenate csv files in a directory. People in the lab have found it helpful so maybe others will as well.
A visual tour of my publications
recently came across this paper by Michal Brzezinski about (the lack of) power laws in citation distributions. It made me a little curious about the citations of my own articles so I threw together a little script using James Keirstead’s Scholar package for R. In the plot above, every line represents a single article with time on the x-axis and (cumulative) number of citations on the y-axis. It’s not super informative, so we can break it down a few ways to graphically explore the data.
Converting Slack’s Team Directory into virtual contact cards
spent the summer as a fellow at University of Chicago’s Data Science for Social Good Fellowship (more on that later) where I got to work on optimizing EMS delivery in Cincinnati (additional press). I’m looking forward to talking about it more once the code and official blog post are made public. Until then, I’m just going to throw up some random code snippets that resulted from the summer.
The colon operator really is the fastest.
ay back when I was first learning R, I ran across an old listserv post that talked about how the colon (:) operator was the fastest way to generate a sequence. I never really thought about it, but I got in the habit of always using it whenever I needed a sequence.
Waterfalls of Eligible Singles
s a Valentine’s Day (gag) gift to one of my friends, I created a Shiny app1 that will calculate the number of people in the United States who meet specified sex, age, marital status, race/ethnicity, educational attainment, employment status, and annual income requirements. Show 1 footnote Shiny homepage ↩
Shiny + deSolve = Interactive ODE Models
hile taking a disease dynamics course, I thought it would be a good opportunity to learn how to use the Shiny package in R and create an interactive interface for some of my problem sets. After a few trial runs with smaller, simpler setups, I have wrapped up the side project (for now). You can see it in action here 1 and you can view the final code on my Git. Show 1 footnote Updated 02/13/15 — moved to shinyapps.io ↩