here was a lot going on last year and I missed my annual tradition of updating my collaboration network at the end of the year. However, thanks to a perpetual illness ravaging the house, I’ve found some sleepless hours to fix my old code and pick up the tradition again. As is always the case when I do this exercise, I can’t help but reflect back on 2022 (and 2021) with gratitude and appreciation for my amazing collaborators. It was my first year on the tenure-track and hours that normally would have been spent pushing research forward were instead spent …
Our paper looking at different COVID-19 testing/quarantine strategies for air travel
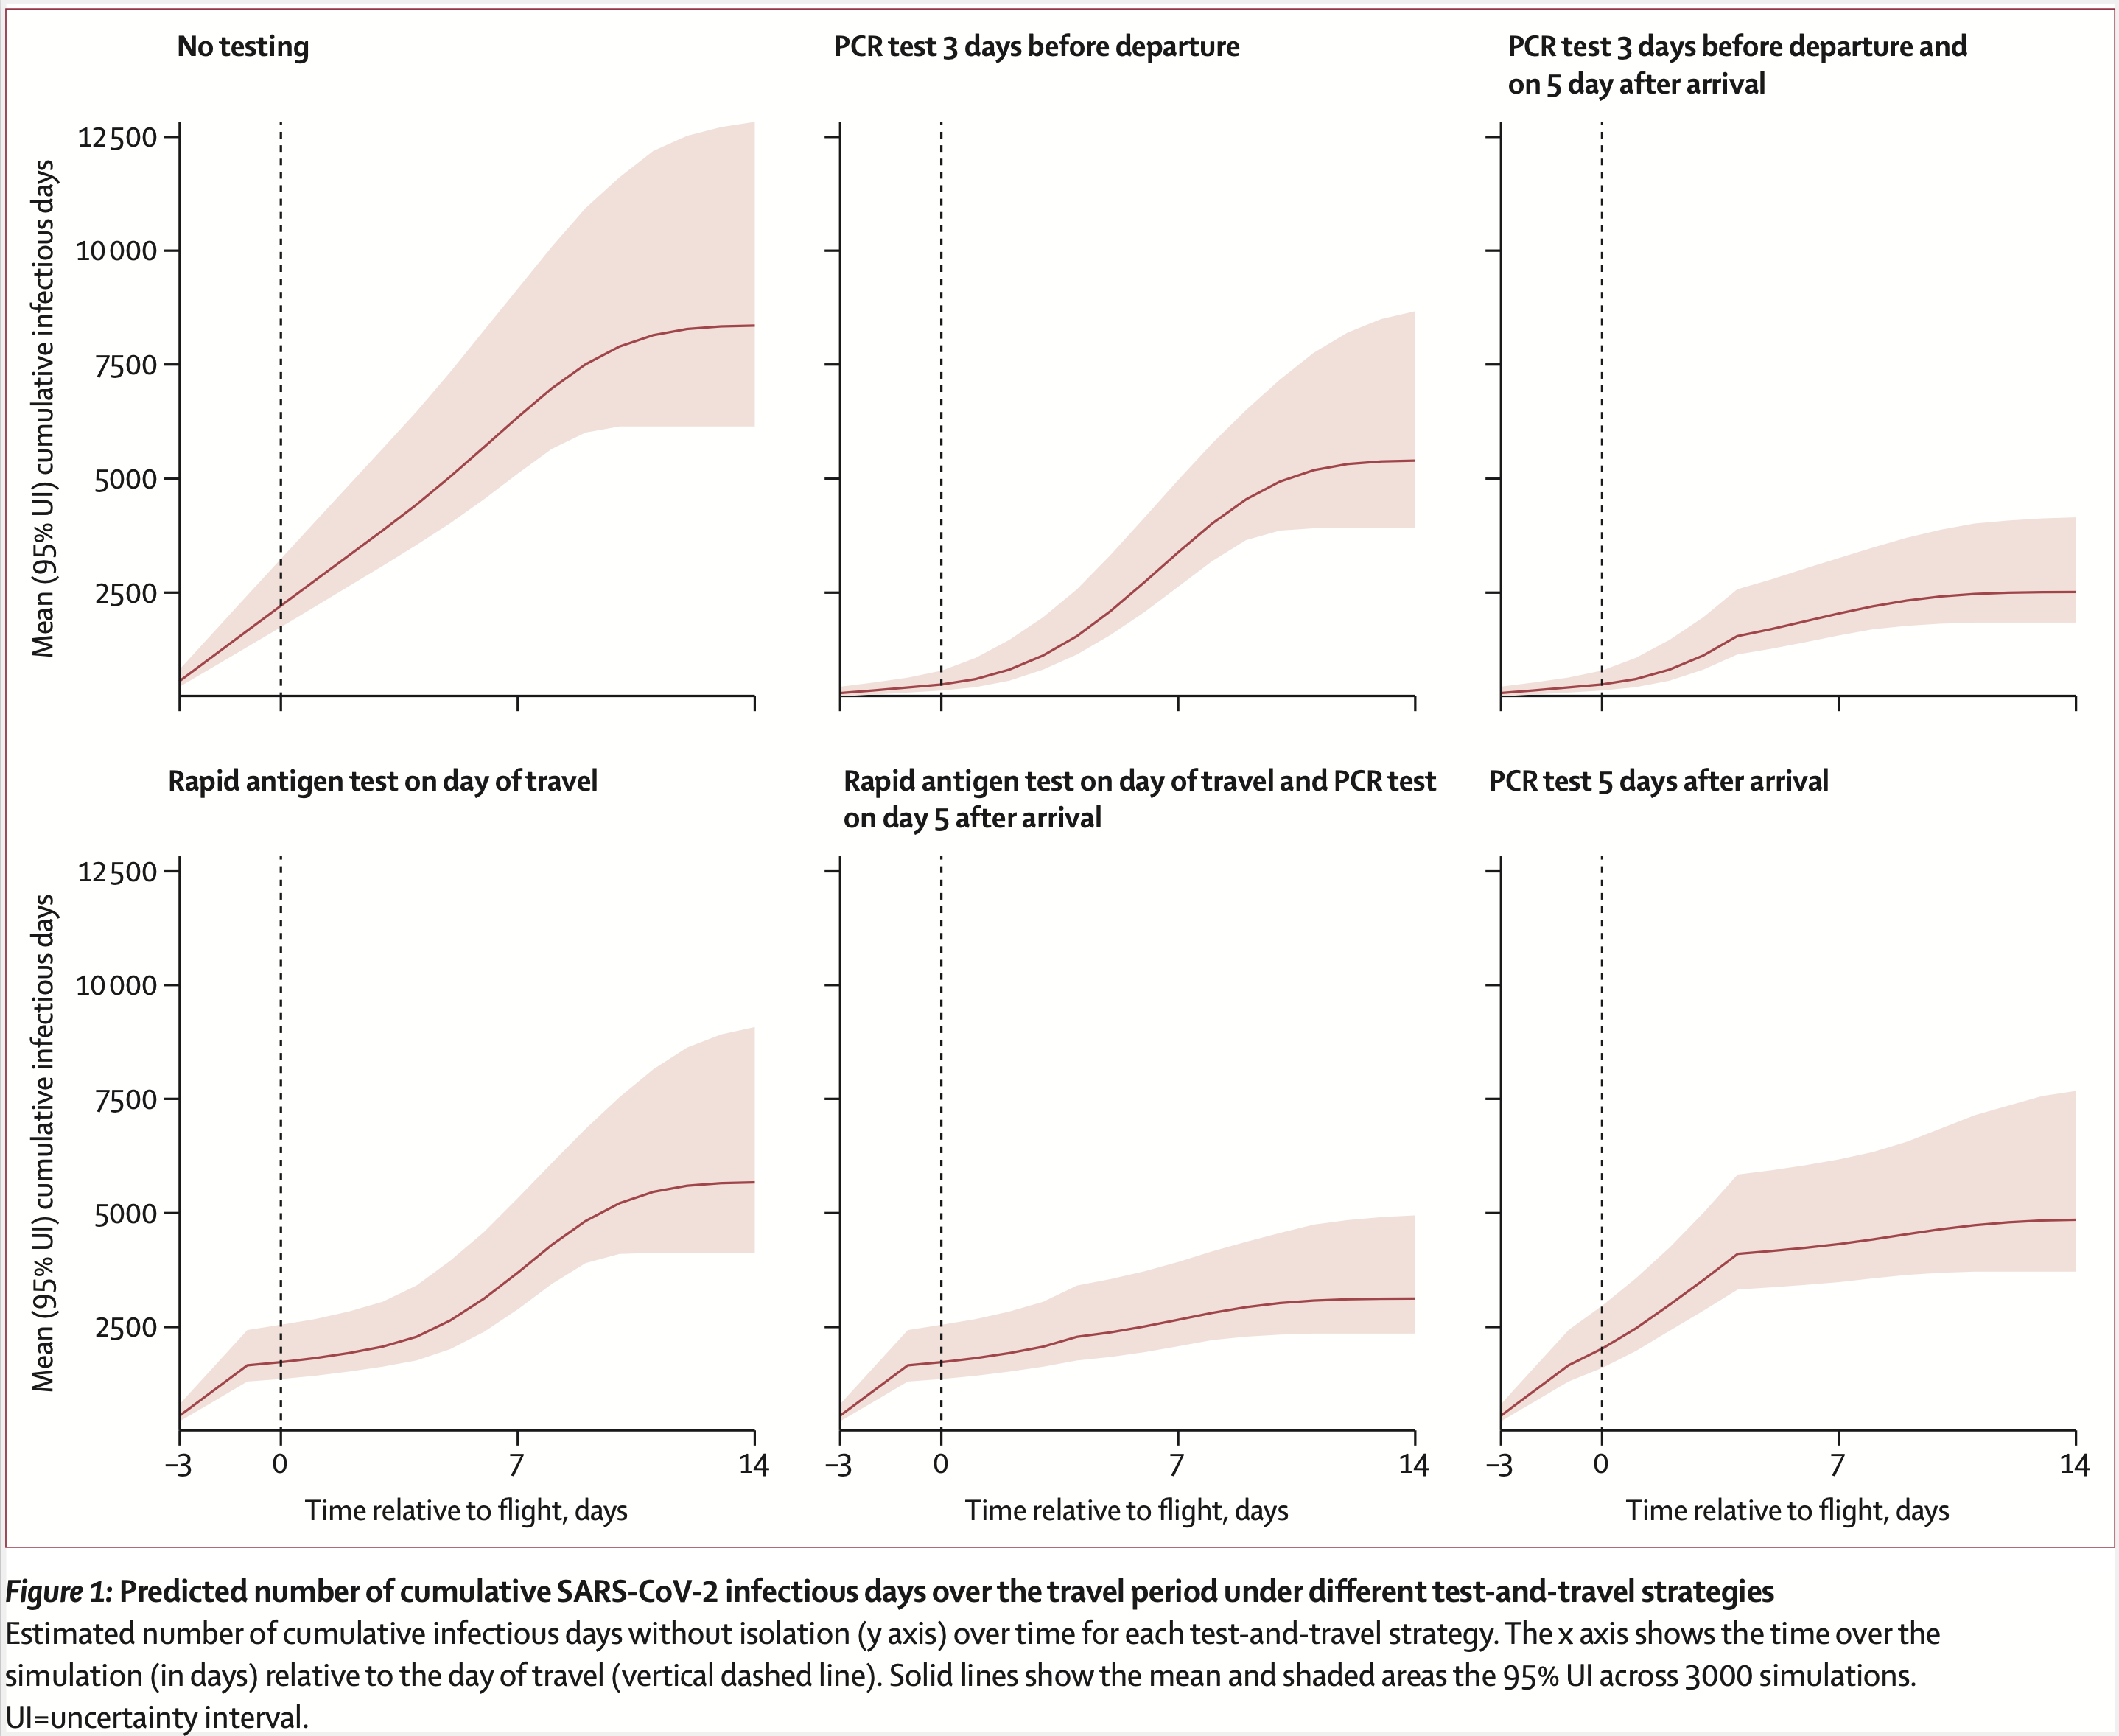
ur new The Lancet Infectious Diseases paper is out. We used microsimulation to evaluate different testing and quarantine strategies for air travel. The simulation incorporates day-specific test sensitivity, asymptomatic infections, and differential levels of adherence to self-quarantine. Given all the travel for holidays and spring break, we’re hoping it provides some useful insight for airlines and public health departments.
Our new paper about opioid prescribing patterns in the US
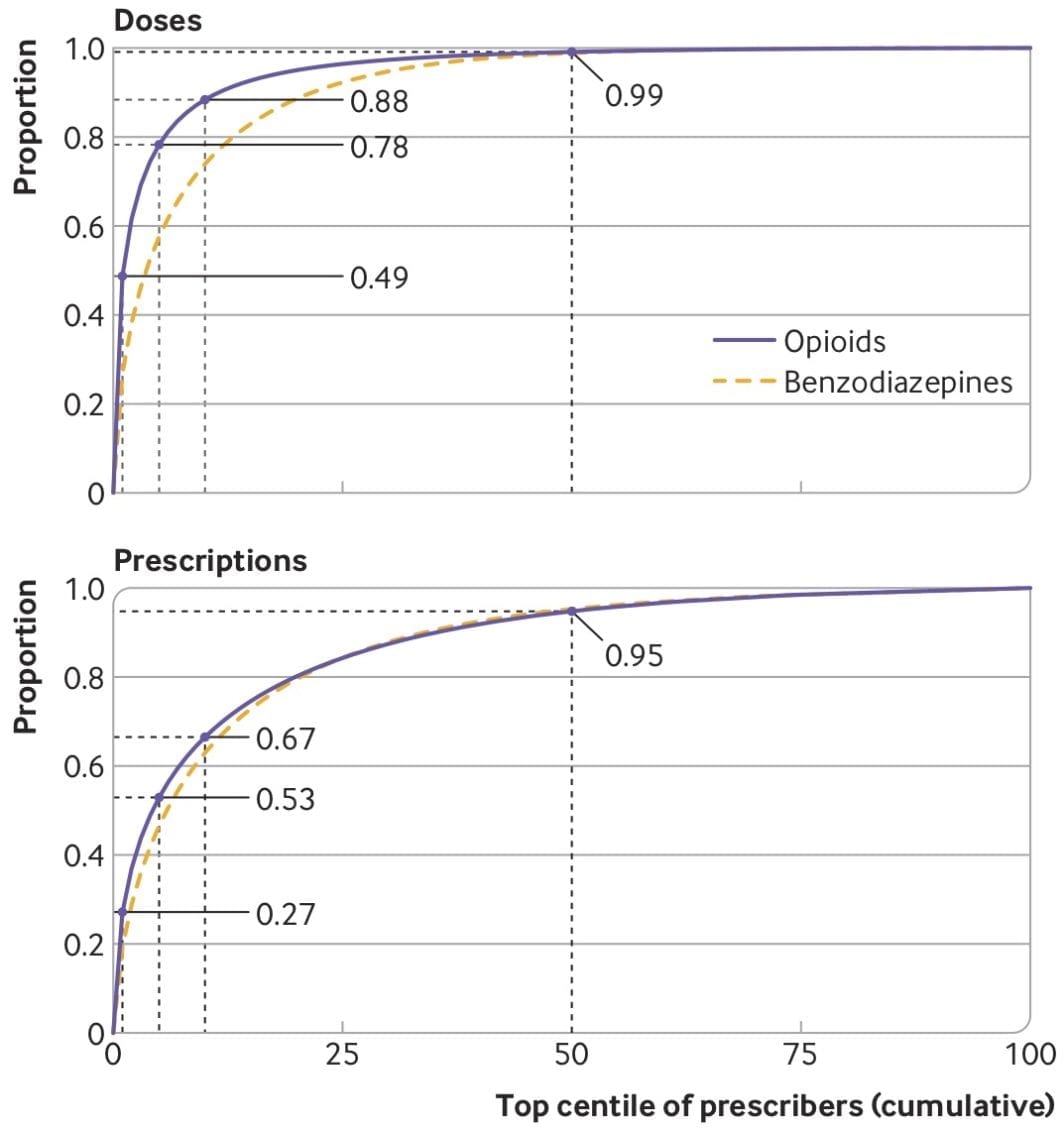
ome notes about a new (open access) paper with Keith Humphreys, Mark Cullen, and Sanjay Basu — “Opioid prescribing patterns among medical providers in the United States, 2003-17: retrospective, observational study” — just published in BMJ.
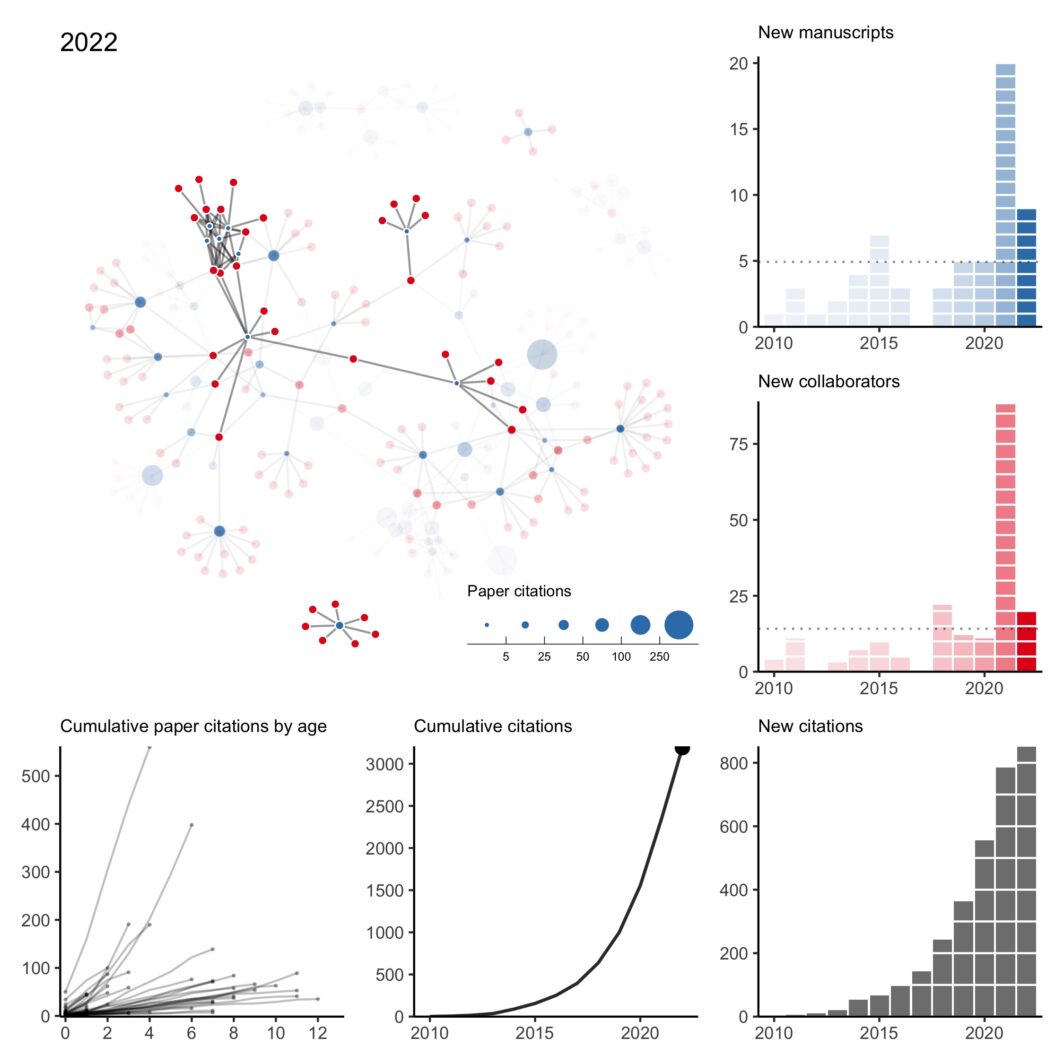
My Collaboration Network
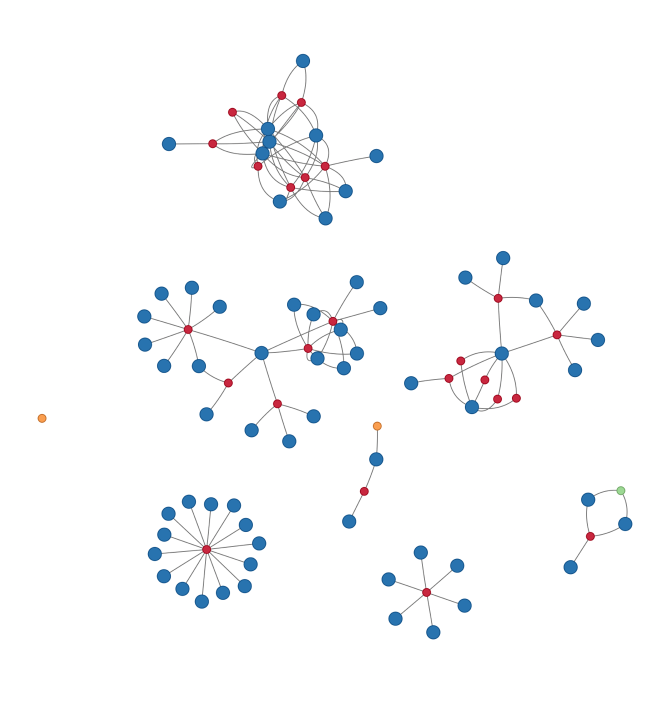
y Twitter timeline is blowing up with #NetSci2018 tweets and awesome visualizations this week, so I was inspired to see if I can quickly make my own “gratuitous collaboration graph” (as Dan would say). Hover over each node to see the name of the paper (red), co-author (blue), or other project (green for data and orange for software).
Our NEJM paper “Mortality in Puerto Rico after Hurricane Maria”
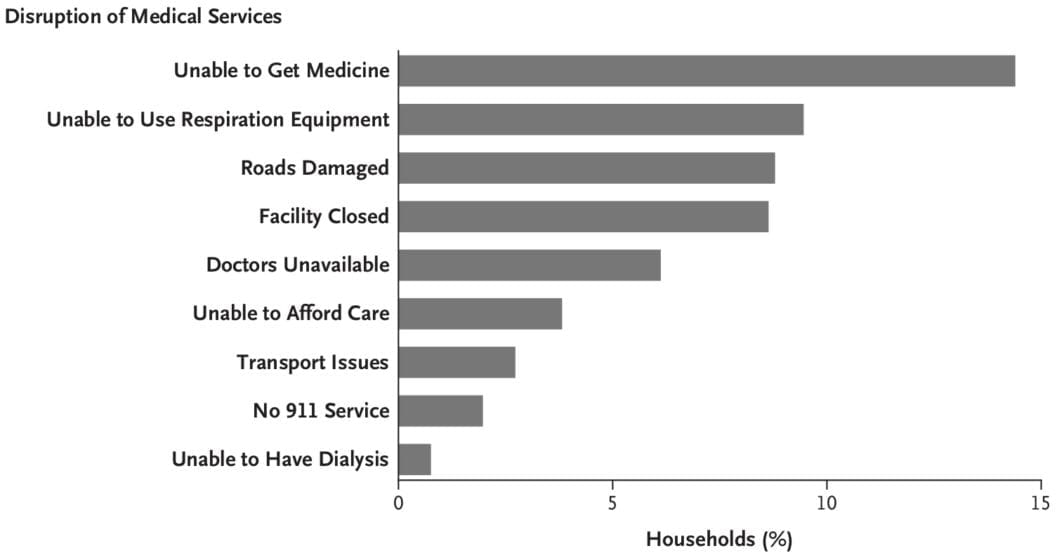
ere is a non-exhaustive list of materials related to our new paper in New England Journal of Medicine, “Mortality in Puerto Rico after Hurricane Maria.” While I normally just link to my papers, this particular paper garnered a significant amount of attention and was viewed over 100,000 times. Not all the attention was good, accurate, or fair — but that is for another post.
Looking at opioid-related mortality, by race, 1979 to 2016
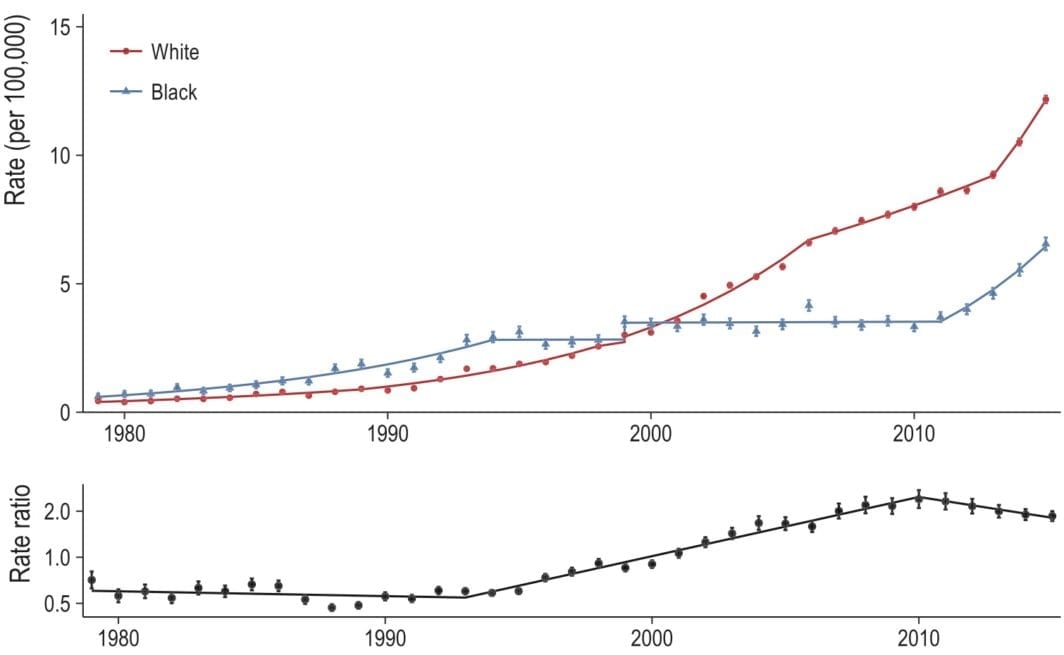
ur paper (with Monica Alexander and Magali Barbieri) is out now (in published ahead-of-print form). Monica has a great, short Twitter thread on the findings so if you don’t want to read the whole thing, check that out. The publisher’s PDF is here. After submitting our paper, the NCHS released the 2016 multiple cause of death files — so a couple months ago we were curious to see how (or if) our results would change when adding the 2016 data. [NOTE (2/25/2019): Since this post, the 2017 data have also been released. I did a similar analysis comparing our original …